NEWS & EVENTS
Time-series model scales variables behind student loan debt
NEWS
Jul 14, 2021
 By Shawn Hutchins
The average cost to complete a degree requires more financial burden today than ever before.
Over the past decade, numerous studies have observed trends in higher education pricing and the issue of rapidly increasing student debt. New approaches in time-series techniques are needed to delve into collections of datasets and to generate forecasts that lead to better pathways to debt management and repayment.
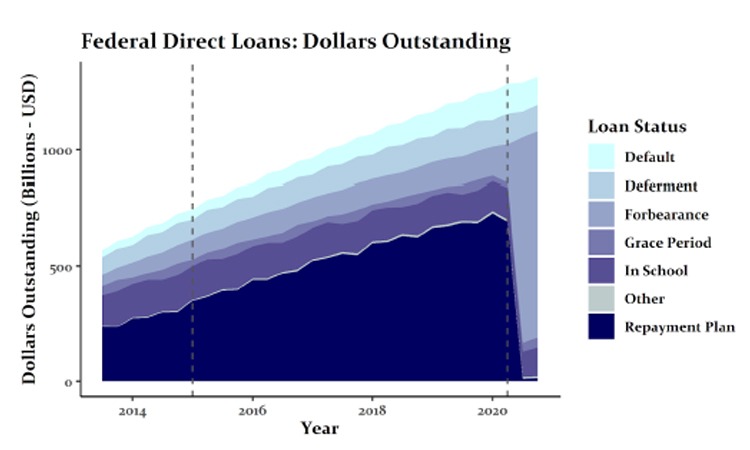
Research by Rice University undergraduate student George Elsesser applied time-series analysis from 2013 to 2020 to break down student loan debt into categories such as loans where the borrower is in school, has loans in deferment, or is within a sixth-month grace period, default, or forbearance. He then used this information to forecast student loan debt within a two-year horizon.
“Perhaps surprisingly, loan amounts for students who are in-school have actually decreased since 2013 alongside a rapid increase for loans that are in repayment and default,” said Elsesser, who earned both a B.A. in statistics and in history from Rice this May with honors and three Conference-USA Commissioner’s Academic Medals for track and field. This June, he began his professional career as a data scientist with Chevron.
Elsesser’s senior capstone project, which was conducted through Rice’s Center for Computational Finance and Economic Systems (CoFES) under Katherine Ensor’s direction, was awarded the university’s Distinction in Creative Works and Research in Statistics. Ensor is the Noah G. Harding Professor of Statistics and director of CoFES.
The independent research project, titled “Predicting Student Loan Debt: A Hierarchical Time-Series Analysis,” was selected to be part of CoFES’s White Paper Series and is available through Rice’s Fondren Library.
The idea for the project came about while Elsesser was a judicial practicum intern for United States Bankruptcy Judge Christopher M. Lopez in the Southern District of Texas. For four months, he observed hearings, discussed judicial philosophy, and researched judicial precedent and policy on issues related to student loan indebtedness and bankruptcy.
“The reality of the student debt crisis in the U.S. for many borrowers is much more complex than a loan lifecycle of up to 10 to 15 years with fixed payments,” said Elsesser. “For example, there are multiple different standardized loan options, many of which are contingent on the borrower’s income, type of employment, or whether the loans were taken out for graduate or undergraduate education.”
Elsesser’s hierarchical time-series analysis reconciles multiple forecasts across a three-level hierarchical data structure. The first level is total federal direct loans from the U.S. Department of Education’s Office of Federal Student Aid. The second level sums up seven loan sub-categories and a third level considers two distinct forms of data – direct loans in deferment and direct loans in forbearance.
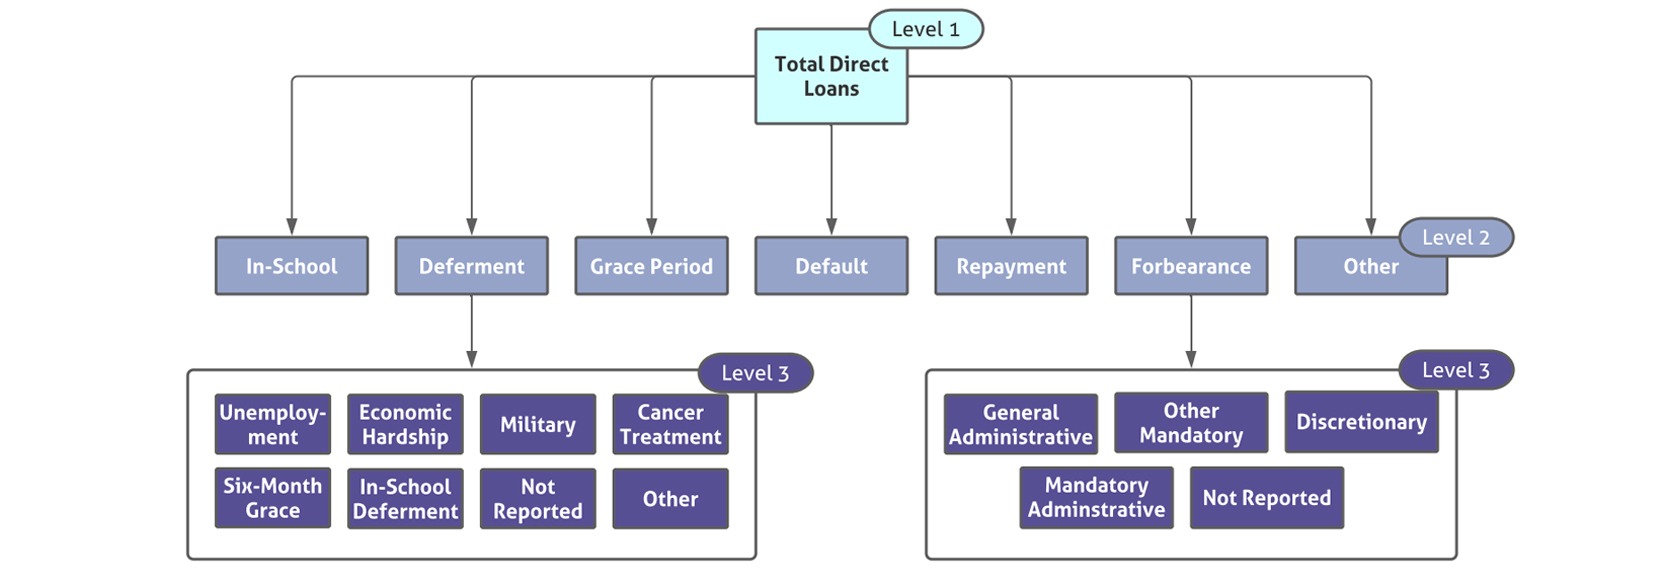
Traditionally, hierarchical time-series forecasting has involved generating forecasts for just one level of a hierarchy and using the one-level forecast(s) to generate predictions for all other levels. Elsesser’s project included up to 20 observations.
“To summarize information from the entire hierarchical data structure in a cohesive model, I used a top-down forecast reconciliation approach, which determined how much of the forecasted aggregate time-series will be distributed to lower-level forecasts,” said Elsesser. “Forecasts were then made using a bottom-up approach to form the forecasts for higher levels in an additive manner.”
After forecasting all series at all levels of the hierarchy, Elsesser then used a Minimum Trace Optimal Reconciliation (MinT) approach introduced by Wickramasuriya (2015) to optimally re-configure a set of forecasts by minimizing error variances. Results indicated that MinT forecast reconciliation with the use of structural scaling results in the most accurate forecasts across the aggregation structure.
One objective of Elsesser’s project was to generate accurate forecasts with the impact of COVID-19 in mind.
To adjust for the extreme data distributions related to the COVID-19 coherent, reconciled forecasts were multiplied by a term he and Ensor coined the “forecast factor.” Here the historical proportions of each sub-category in comparison to the aggregate total from before Covid-19 related data disruptions were divided by corresponding historical proportions after.
“In the coming years, creative financial management and forecasting tools will be needed to account for economic shifts resulting from the global pandemic, Elsesser said.”
As Elsesser advances in his professional career in statistics and data science, he, like many others, will be weighing the variables behind attending law school in the future.