NEWS & EVENTS
The shape of data
NEWS
Nov 3, 2020
 By Shawn Hutchins
Rice University data scientist Kathy Ensor and graduate student Alejandro Aguilar are combining topological data analysis and statistical algorithms to study the multidimensional landscape of stock market volatility.
In a technical paper, the researchers provide a topological view of the relationships between four U.S. stock market indices: the S&P 500, Dow Jones Industrial Average, Nasdaq Composite, and Russell 2000 and 10 ETF sectors over a 10-year period to gain deeper insight into events when stock markets fall.
To pinpoint the optimal length of data trends, they use a sliding window to mark statistical parameters that can slide by steps of one trading day up to 50 trading days.
“Just as biologists use methods from algebraic topology to map dynamic protein-folding structures and their downstream process, we apply a sequence of topological functions to analyze the conditions under which markets fail to produce,” said Alejandro Aguilar, a fourth-year doctoral student in the Department of Statistics at Rice University, who also conducts research under Kathy Ensor’s direction in Center for Computational Finance and Economic Systems (CoFES).
There is a tremendous amount of data that surround the conditions in which markets fall, and the researchers believe somewhere in all that data there might be warning signals that could indicate when a critical event is likely to occur.
“Topological data analysis is being combined with statistical methods and powerful computational tools to show that data has a shape. We can also use the sliding window technique to focus on partitions of time to rigorously quantify critical transitions,” said Ensor, the Noah G. Harding Professor of Statistics and director of CoFES.
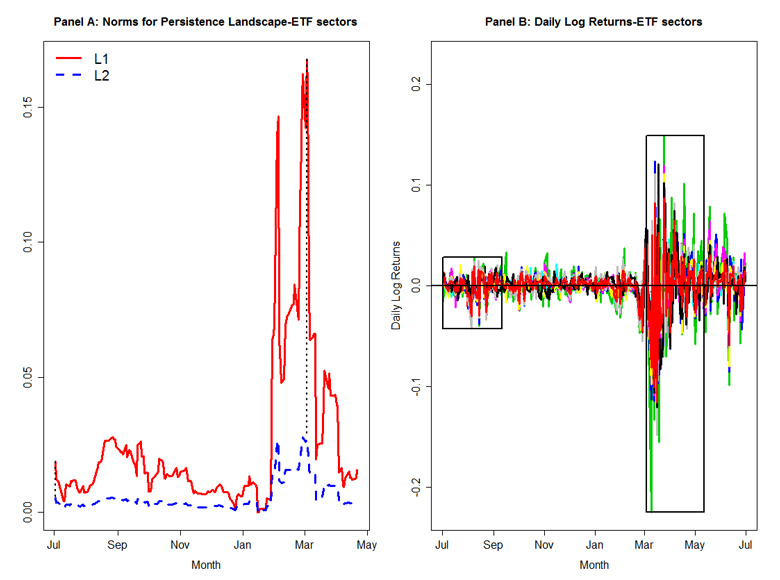
The images above are the norms of the persistence landscapes and the daily log-returns of all the ETF sectors from July 2, 2019 to June 30, 2020. Panel A is the norms of the persistence landscape, where each point in the figure represents a sliding window of 50 trading days, and two dashed lines depict the first and maximum points. Panel B plots the daily log returns with two sliding windows of 50 trading days corresponding to the first and max points in Panel A. The first sliding window is from July 2, 2019 to September 11, 2019, while the second sliding window is from March 3, 2020 to May 12, 2020. The reporting period of this figure contains 253 trading days from July 1, 2019 to July 1, 2020.
“The knowledge gained from these studies could help economists make informed decisions in building and establishing recovery plans after a crash,” said Ensor. “These tools are evolving rapidly, becoming more accessible, and are impacting university research and education.”
After honing in on particular partitions of time, the Rice researchers converted the data into a 3-D point cloud for topological analysis.
Aguilar is from the Texas Rio Grande Valley. He has a B.S. and M.S. in applied mathematics from the University of Texas-Pan American, and a B.A. in economics and a minor in German from the University of Michigan-Ann Arbor.
In addition to his doctoral research with Ensor on financial time-series data, Aguilar is also working with three additional doctoral students to develop real-time tools that inform the Houston Health Department and the public of elevated benzene levels in the region.
The financial research was partially supported by CoFES. The air quality work is supported by Rice’s Houston Solutions Lab and the Houston Health Department.